
Past Retreats: 2010 Image Competition Entries
Click to view larger images.
Competition Winner:
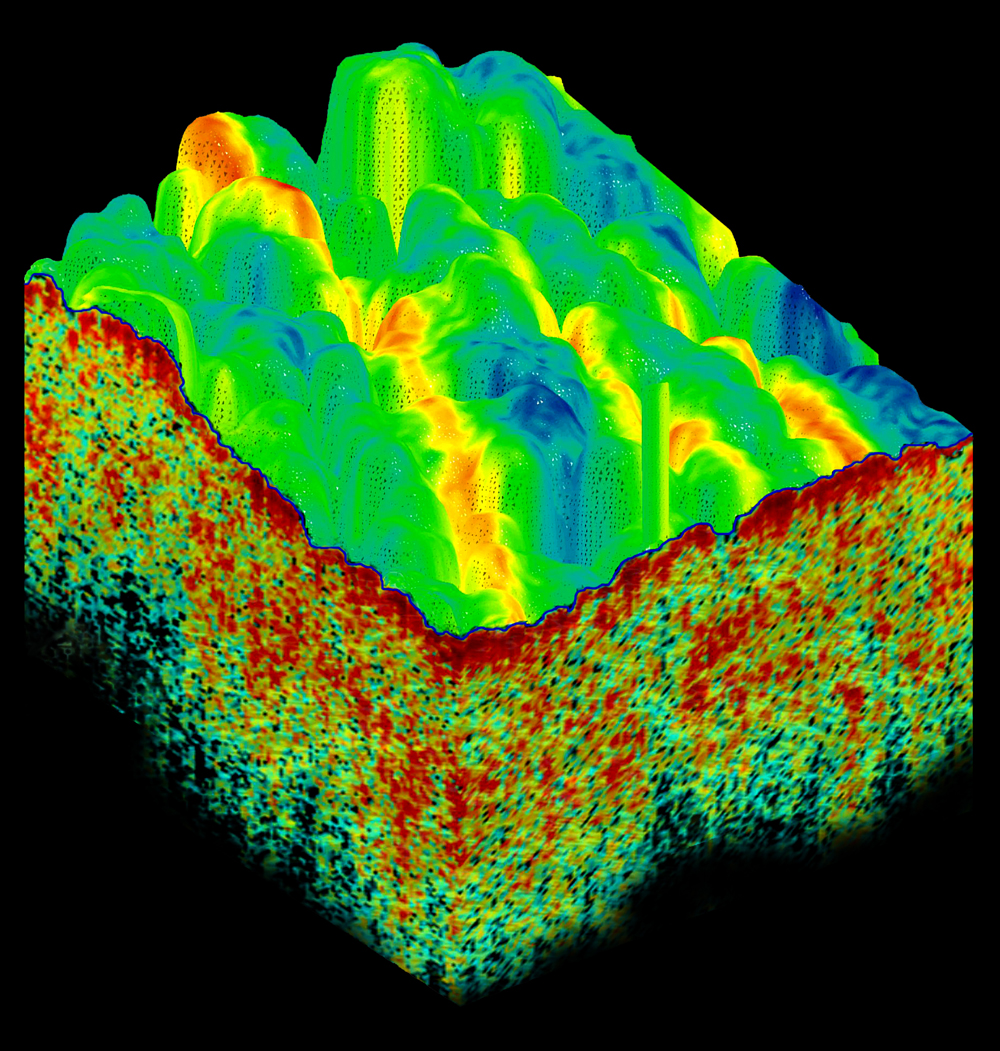
Jana Kainerstorfer, MS
Section on Analytical and Functional Biophotonics (Amir Gandjbakhche Lab)
The image shows a 3D volume of a human forearm, combining metabolic and structural information. Two different optical imaging modalities have been used, namely diffuse multi-spectral imaging and Optical Coherence Tomography (OCT). Multi-spectral imaging enabled us to extract blood volume concentrations over the entire image area (4cm x 4cm); OCT was used to obtain the 3D structure of the epidermis and dermis. Image segmentation on the OCT image was performed to extract the surface of the arm, used for mapping blood concentration. Hence the upper part of the image is the skin surface, colorcoded with blood concentrations in the underlying skin. Veins can be clearly identified due to increase in blood. The lower part of the image shows the structure of the skin obtained by OCT, where the epidermal and dermal structures can be well separated from each other.
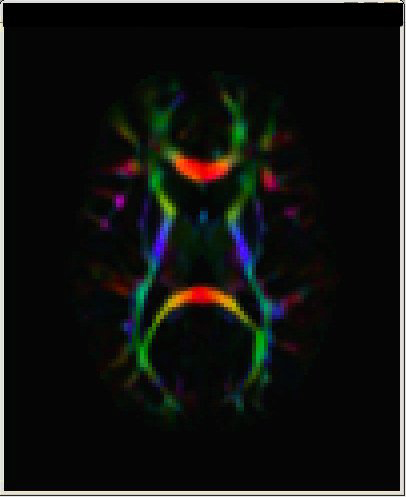
Amritha Nayak
Section on Tissue Biophysics and Biomimetics (Peter Basser Lab)
Image of a Directionally encoded color (DEC) map of the human brain obtained using diffusion tensor MRI showing the white matter pathways. This tool is useful in visualizing the fiber directions within the brain enabling the investigation of the structural anatomy.
Reference: Sinisa Pajevic and Carlo Pierpaoli. (1999) Color Schemes to Represent the Orientation of Anisotropic Tissues From Diffusion Tensor Data: Application to White Matter Fiber Tract Mapping in the Human Brain. Magnetic Resonance in Medicine 42:526–540.
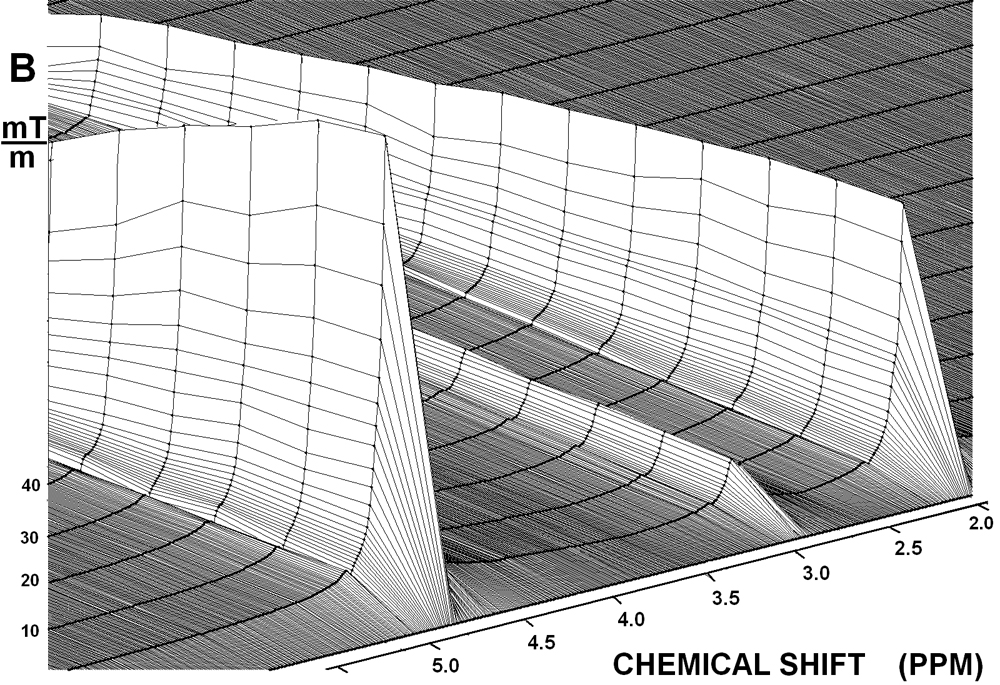
Alexander Novikov, PhD
Section on Tissue Biophysics and Biomimetics (Peter Basser Lab)
3-dimensional view of NMR spectrum attenuation by diffusion gradients. Solution of N-acetyl-L-aspartic acid (NAA) in deuterium oxide (D2O). Water residue peak (4.8 ppm) is attenuating much more than NAA peak (2.06 ppm) with increasing diffusion gradient field intensity.
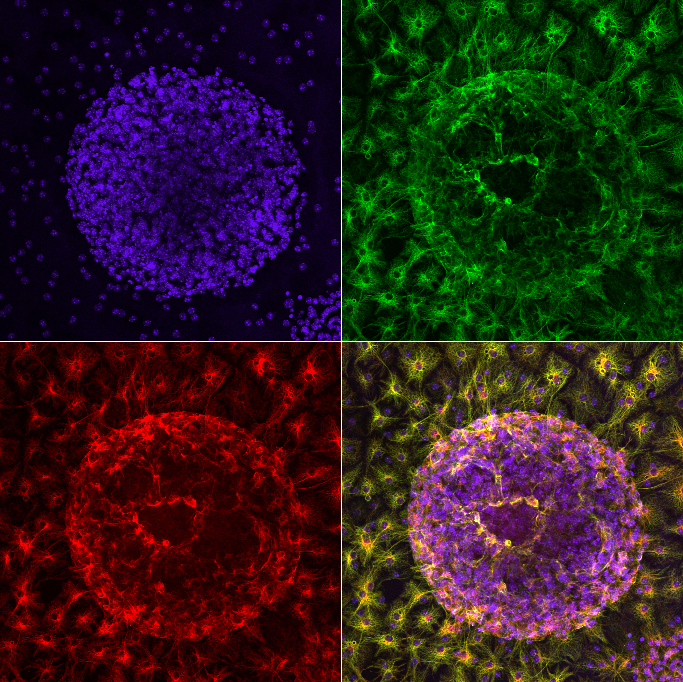
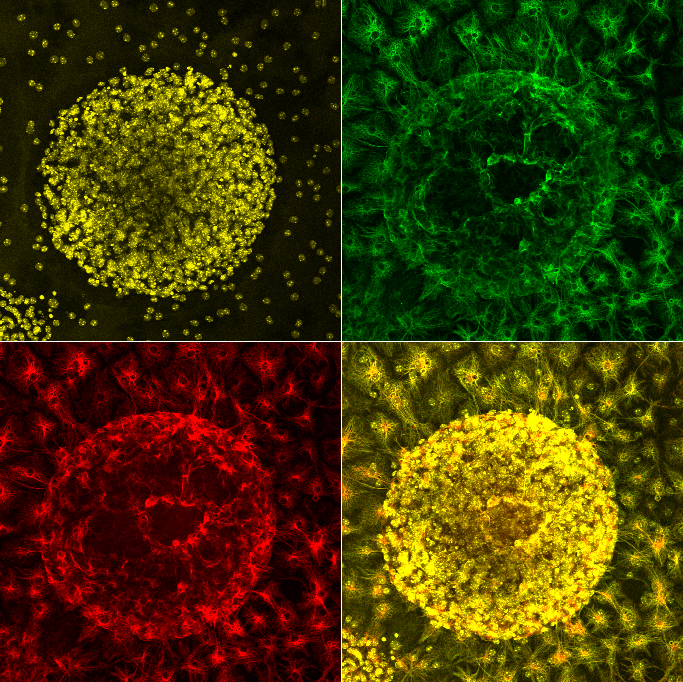
Arjun Saha, PhD
Section on Developmental Genetics (Anil Mukherjee Lab)
Fatty acid synthase expression in Astrocyte differentiating from neuronal stem cells (neurospheres). DAPI, FASn and GFAP are pseudo-colored. (1 of 3)
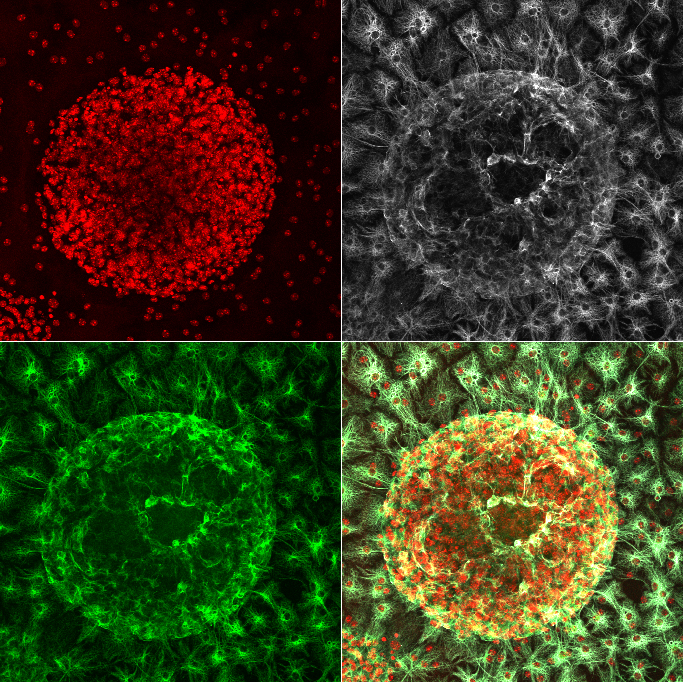
Arjun Saha, PhD
Section on Developmental Genetics (Anil Mukherjee Lab)
Fatty acid synthase expression in Astrocyte differentiating from neuronal stem cells (neurospheres). DAPI, FASn and GFAP are pseudo-colored. (2 of 3)
Arjun Saha, PhD
Section on Developmental Genetics (Anil Mukherjee Lab)
Fatty acid synthase expression in Astrocyte differentiating from neuronal stem cells (neurospheres). DAPI, FASn and GFAP are pseudo-colored. (3 of 3)